
It’s taken this long to accept the reality of the recent Australian Election result.
And with the election “euphoria” rally officially over we can get back to considering some of the real economic issues facing Australian investors right now.
But before we get to the Aussie position, it’s important to reveal some global context.
For the US, as the chart below shows, recessionary
winds haven’t mattered, and, by any metric, US markets are a joke overvalued.
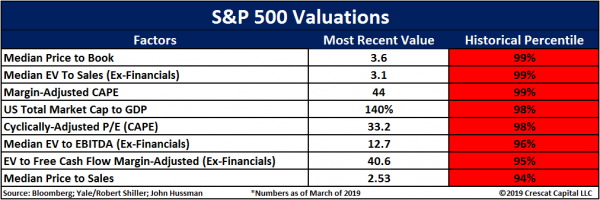
Nothing to see here.
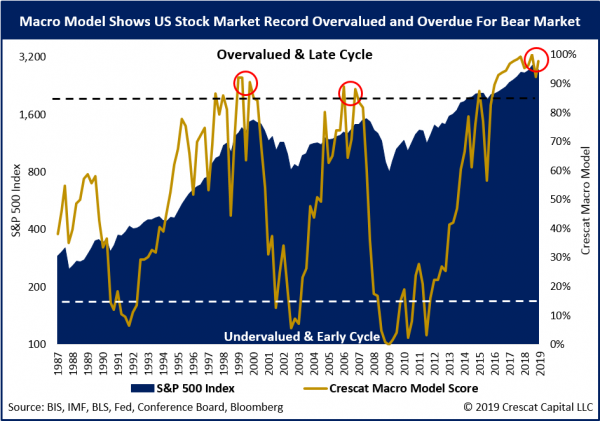
Or here.

Nor this.

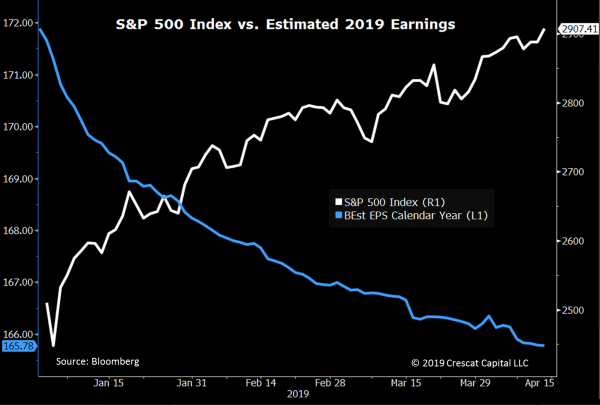
This was normal.
In our last missive we suggested that the mixed message’s being given to us by equity and Bond markets will be reconciled one way or another in the short term.
We didn’t have to wait long.
Bond markets across the globe are now shouting “recession”!!
Global Stocks may be just rollin over but Bond yields are collapsing.
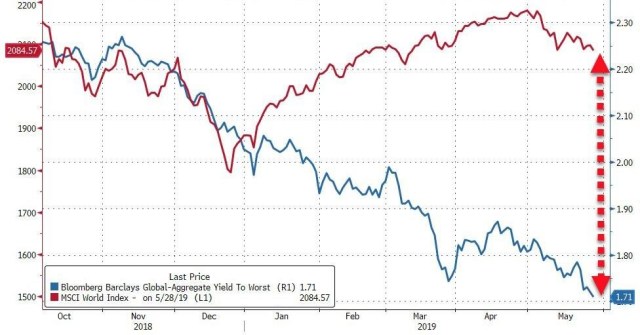
Including Australia, been a while since we’ve seen this.
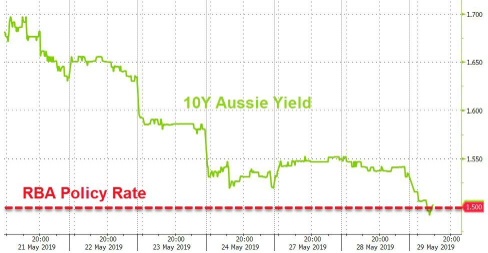
Whilst we’re on the subject of Australia, the words “perfect storm” seem to sum up best what may be happening.
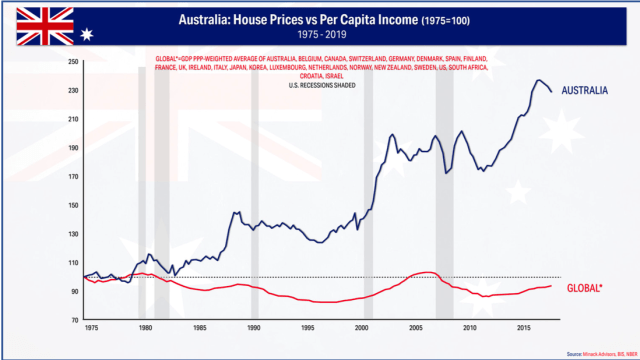
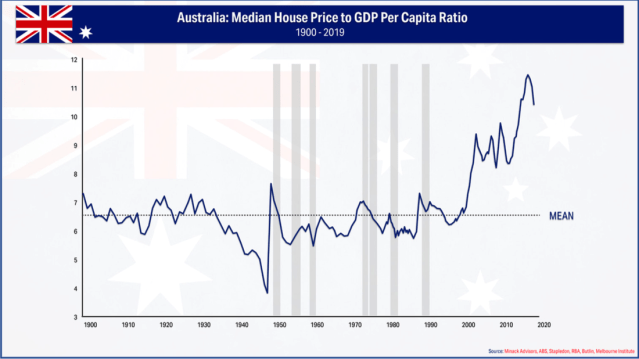
Ground zero will be housing, as we’ve said many times before.
The following charts are a few of many presented by Grant Williams at the Strategic Investment Conference last week.
We present them without comment.
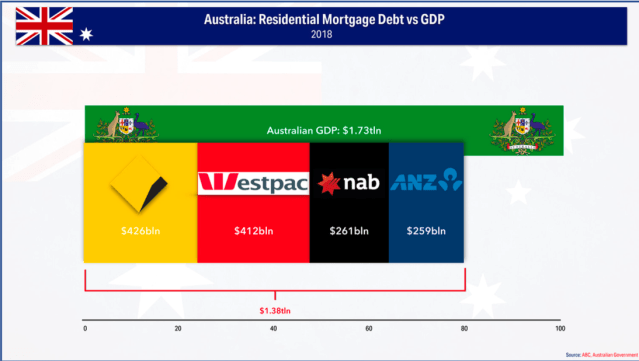
Enjoy your rate cut next week if you’ve a mortgage, commiserations to savers and retirees being forced to take more risk for yield, like the rest of the world.
Finally, what might this below look like in a month? Currently $1860.
End of Financial Year Historical Bullion Prices (in AUD and USD per troy ounce)
| Date | GOLD AUD Price | GOLD USD Price | SILVER AUD Price | SILVER USD Price |
| 30/06/1999 | 394.76 | 261.25 | 7.89 | 5.22 |
| 30/06/2000 | 482.60 | 289.8 | 8.36 | 5.02 |
| 30/06/2001 | 532.26 | 270.6 | 8.46 | 4.3 |
| 30/06/2002 | 557.78 | 314.2 | 8.56 | 4.82 |
| 30/06/2003 | 514.34 | 346.1 | 6.75 | 4.54 |
| 30/06/2004 | 562.54 | 392.2 | 8.26 | 5.76 |
| 30/06/2005 | 570.41 | 434.65 | 9.16 | 6.98 |
| 30/06/2006 | 823.68 | 611.5 | 14.96 | 11.11 |
| 30/06/2007 | 765.98 | 649.4 | 14.63 | 12.4 |
| 30/06/2008 | 966.90 | 926.1 | 18.18 | 17.41 |
| 30/06/2009 | 1155.90 | 934.5 | 17.72 | 14.32 |
| 30/06/2010 | 1460.35 | 1241.3 | 21.74 | 18.48 |
| 30/06/2011 | 1407.37 | 1510.95 | 32.44 | 34.83 |
| 30/06/2012 | 1563.50 | 1599.3 | 27.03 | 27.65 |
| 30/06/2013 | 1352.28 | 1236.25 | 20.41 | 18.86 |
| 30/06/2014 | 1397.54 | 1316.4 | 22.35 | 20.96 |
| 30/06/2015 | 1533.18 | 1174.8 | 20.62 | 15.72 |
| 30/06/2016 | 1769.72 | 1314.90 | 24.73 | 18.38 |
| 30/06/2017 | 1620.20 | 1244.15 | 21.79 | 16.73 |
| 30/06/2018 | 1695.25 | 1252.45 | 21.95 | 16.22 |
Source: FastMarkets – 5pm Sydney time of the last trading day of the Financial Year.
More on Gold in a separate note soon.

Recent Comments