
Time goes fast. It’s that time of the year again when the IMF approves its latest Greece “bailout”. Ha. Hardly a whimper of reporting on this one, nor on the Netflix push through a valuation of 200 times its earnings!!
The Greek bailouts are a constant reminder of how interconnected the financial system is. Every Greek “bailout’ is not a bail of Greece but an injection of liquidity so as not to distress Greece’s main lenders, European Banks, and reduce the risk that this stress may spread across the Atlantic and the globe.
A timely reminder for Australian investors not to be caught scratching our heads when a seemingly unrelated international event negatively impacts our asset prices (or positively, if you’re well positioned).
We can understand (and even believe ourselves on some days) the faith in Central Bankers to print enough money to cover ANY problem the financial world can dish up but when things look a little ridiculous it pays to stop and think. And this piece below from David Stockman certainly got us thinking. David Stockman was a two-term Congressman from Michigan. He was also the Director of the Office of Management and Budget under President Ronald Reagan. After leaving the White House, Stockman had a 20-year career on Wall Street.
David Stockman was a two-term Congressman from Michigan. He was also the Director of the Office of Management and Budget under President Ronald Reagan. After leaving the White House, Stockman had a 20-year career on Wall Street.
On July 10, 2007, former Citigroup CEO Chuck Prince famously said what might be termed the “speculator’s creed” for the current era of Bubble Finance. Prince was then canned within four months but as of that day his minions were still slamming the “buy” key good and hard:
“When the music stops, in terms of liquidity, things will be complicated. But as long as the music is playing, you’ve got to get up and dance. We’re still dancing,” he said in an interview with the FT in Japan.
We are at that moment again. Only this time the danger of a thundering crash is far greater.
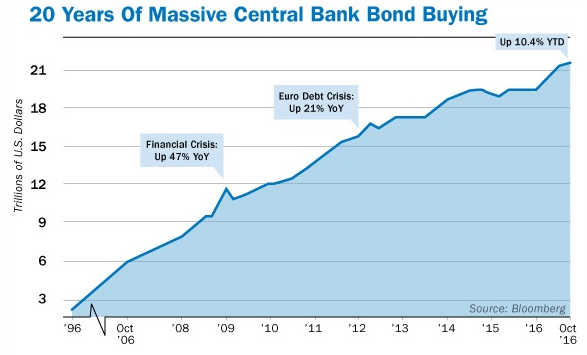
That’s because the current blow-off top comes after nine years of even more central bank policy than Greenspan’s credit and housing bubble.
The Fed and its crew of travelling central banks around the world have gutted honest price discovery entirely. They have turned global financial markets into outright gambling dens of unchecked speculation.
Central bank policies of massive quantitative easing (QE) and zero interest rates (ZIRP) have been sugar coated in rhetoric about “stimulus”, “accommodation” and guiding economies toward optimal levels of inflation and full-employment.
Bond and stock prices are way too high, and that reality has infected the very foundations of the financial system. Like the hapless Chuck Prince last time, today’s traders and robo-machines have lost all contact with the fundamentals of corporate performance, macroeconomic outlooks and the political risks of a Washington.
Traders today are just dancing – blindly. That’s why the Russell 2000 hit 1442 the other day, capitalising the earnings of small and mid-cap domestic companies at 87.5 times.
That’s crazy in its own right. As measured by value added output of the U.S. business sector, the main street economy – where most of these companies live — has expanded at a tepid 2.1% annual rate since 2002. By contrast, the RUT index has increased by 10% per annum since then.
At the same time, the level of speculation in the hyper-momentum tech stocks is even more stunning.
We are in the blow-off stage of the Fed’s third and greatest bubble of this century. Yet the stock market has narrowed drastically during the last thirty months, as is typical of a speculative mania. This narrowing means that the price-earnings ratio (PE) among the handful of big winners have soared.
P/E Normalisation,
FAANGs and Bubble Finance
In the case of the so-called “FAANGs + M” (Facebook, Apple, Amazon, Netflix, Google and Microsoft), the group’s weighted average PE multiple has increased by 50%.
The combined earnings of the group have grown by just 20%. 75% of this huge gain in market cap is attributable to multiple expansion, not operating performance.
The degree to which the casino’s speculative mania has been concentrated in the FAANGs + M can also be seen by contrasting them with the other 494 stocks in the S&P 500. The market cap of the index as a whole rose from $17.7 trillion in January 2015 to $21.2 trillion at present, meaning that the FAANGs + M account for 40% of the entire gain!
If this concentrated gain in a handful of stocks sounds familiar that’s because this rodeo has been held before. The Four Horseman of Tech (Microsoft, Dell, Cisco and Intel) at the turn of the century saw their market cap soar from $850 billion to $1.65 trillion or by 94% during the manic months before the dotcom peak.
At the March 2000 peak, Microsoft’s PE multiple was 60 times, Intel’s was 50 times and Cisco’s hit 200 times. Those nosebleed valuations were really not much different than Facebook today at 40, Amazon at 190 and Netflix at 217 times PE.
The point is, even great companies do not escape drastic over-valuation during the blow-off stage of bubble peaks.
That spectacular collapse was not due to a meltdown of their sales and profits. Like the FAANGs +M today, the Four Horseman were quasi-mature, big cap companies that never really stopped growing.
For example, Cisco’s revenues have increased from $15 billion to $50 billion annually during the last 17 years and its net income has tripled to $10 billion. Yet Cisco’s market cap today is just $160 billion or only 30% of its 17-years ago bubble peak.
The reason is PE normalisation. In this case, the company’s hideously inflated 200 times PE multiple imploded with the tech crash. It now stands at 15 times PE.
Amazon and the Chuck Prince Market Redux
Amazon is now set for that kind of PE implosion during this cycle. It’s stock price doubled from $285 per share in January 2015 to $575 by October of that year, and then it doubled again to $1026 in the 20 months since.
Along the way, it picked up a hefty $350 billion in added market cap. That’s nearly $12 billion of value gain per month!
Amazon is now 24 years-old, not a start-up; and it hasn’t invented anything explosively new like the iPhone or personal computer. Yes, it is taking retail market share by leaps and bounds, but that’s inherently a one-time gain that can’t be capitalised to infinity.
Indeed, 91% of its sales involve sourcing, moving, storing and delivering goods — a sector of the economy that has grown by just 2.2% annually in nominal dollars for the last decade.
Amazon embodies the speculative mania of the current market. It is simply ludicrous to put a multiple of 190 times PE on a company that runs a profitless $130 billion e-Commerce sales juggernaut.
Even as its stock price has tripled during the last 30 months, AMZN has experienced two sharp drawdowns of 28% and 12%, respectively. As shown in the first chart below, both times it plunged to its 200-day moving average in a matter of a few weeks.
A similar drawdown to its 200-day moving average today would result in an immediate 16% sell-off. But when, not if, the broad market plunges into a long overdue correction the ultimate drop will exceed that by a greater magnitude.
In the meanwhile, the market mindlessly melts-up because the Fed has destroyed all of Wall Street’s natural forces of financial discipline. Eight years of central bank money printing and intrusion have destroyed short-sellers and caused day-traders and robo-machines to be wired to buy every dip.
Never mind about the gong show in Washington. Or even the fact that the Keynesian economists in the Fed’s Eccles Building do actually intend to normalise rates and shrink the Fed’s balance sheet.
The talking heads wandering around Wall Street have come to the delusional belief that the bubble can live forever without help from Washington or the Fed.
Make no mistake, this is the Chuck Prince Market Redux. Only the daredevils and Wall Street dancing machines would dare buy the S&P 500 at 25 times PE, the Russell 2000 at 88 times PE, Amazon at 190 times PE.
Now consider what the policy response will be if a “correction to the mean” scenario eventuates, or consider, what needs to be done by way of continued monetary stimulus to keep this show on the road.
We now hope you understand why proper portfolio diversification includes an allocation to gold!
As usual, you’re welcome to drop us a note or give us a call with any questions around portfolio positioning.

Recent Comments