
As of today, what with the Australian All Ords down close to 250 points since its peak in early May, you are entitled to ask “are we still calm?”.
Before last Thursday global equity markets were on the cusp of “peak calm”. No volatility whatsoever. We may well find it’s still ok once Europe and the US reopen the spigots tonight. Fixed, they say, as per the lack of Volatility, as measured by the VIX.
In terms of US equities, the daily snooze has looked like this below:

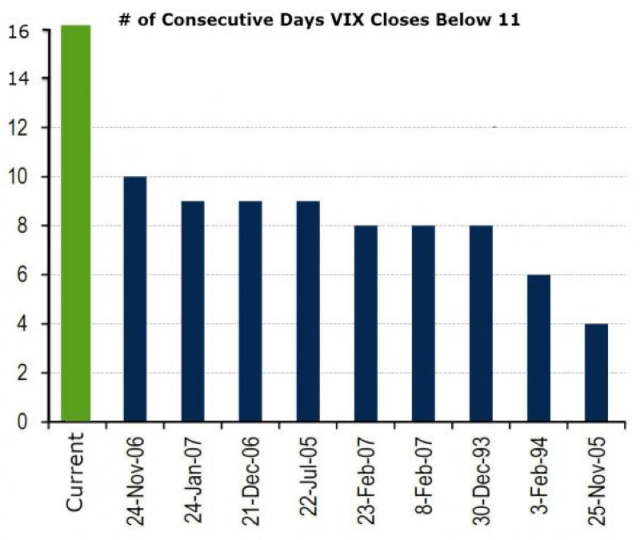
Our point with today’s note is that this type of complacency has rarely been experienced and, right now, there are a lot of people that fully believe that $200billion a month of central bank largesse is enough!!
They may, in fact, be right!
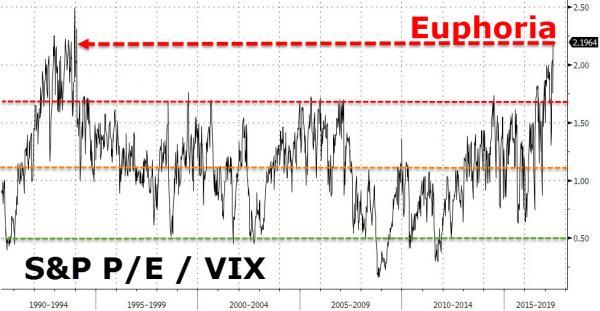
It seems nothing can derail this era of awesome “stability”.
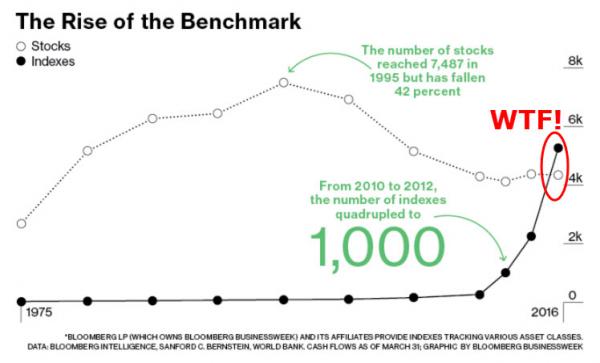
So much so that movement of money from the “old” style active Fund Managing to “cheap” passive index ETF’s, GLOBALLY, is continuing to accelerate.
We now have a massive move of money into a sector that, for most, has never even experienced even a garden variety financial “correction”.
Examples abound as to why investors are moving into these types of structures.
Retiree’s looking to lower fees in the face of a low-interest rate environment is one. Understandable from a fee perspective but questionable in preservation of capital strategy in untested structures. Trend following GenY and Millennials are another. Robo advice and ETF’s, life on the tech edge!! Must be good, everyone’s doing it!!
According to Bloomberg, the phenomenon is more profound in the US than here in Australia to the point where there are now more indexes than actual stocks.
Stressed out financial markets and associated knock-ons are now buried so deep in the memory banks of investors that most seem like millennial investors. Investors that have never experienced a macro credit stress event.
The irony of using the “VIX” as the benchmark of volatility lies in the question of what you get when if you purchased a bit of (VIX) Volatility. Or more to the point what would you end with if you had to, for some unforeseen reason, take ownership of it.
To understand what you’d get requires a whole new level of jargon. The type of jargon that takes one back to another “peaceful” period- 2007.
For those unfamiliar with the financial “product creation” we’ve cut-n-pasted a snippet of an announcement from Citigroup on a new one they’ve done recently, related to the “VIX”. If the following jargon makes you feel financially illiterate relative to the 20something author, fear not! This “superior” product knowledge is demonstrated institutional commitment to extinction.
(Emphasis added)
LONDON, May 16th (IFR) – Citigroup has launched a credit equivalent of Wall Street’s “fear gauge” that is intended to provide an accurate metric for risk aversion in the asset class.
Citi’s “credit VIX” mirrors the CBOE’s VIX methodology, using a weighted average of option prices on credit default swap indices across a range of strikes.
The new index, which tracks implied volatility across investment-grade and high-yield CDS indices in the US and Europe, was developed in response to rising interest in the VIX as it plummeted to its lowest level in a quarter of a century last week.
“We replicated this methodology to create a ‘credit VIX’, which we think captures a lot more information contained within option markets, allowing it to serve as a more accurate metric for broad risk aversion, and one which we think investors should track going forward,” said Aritra Banerjee, a credit analyst at Citigroup.
As one of the fastest growing instruments for bank credit desks, CDS index options have become popular among investors to hedge credit tail events. Given the high demand is for downside protection, a steep skew – the difference between at-the-money and out-of the-money strikes – would be ignored by traditional risk barometers.
“At present we usually look at things like at-the-money implied volatility or payer skew to ascertain the level of risk being priced in credit markets,” said Banerjee. “However, looking at just one point misses useful information contained elsewhere in option prices.”
According to Banerjee, clients are already keen to trade instruments linked to the benchmark, enabling them to trade pure credit variance in a single transaction.
The liquidity profile of the credit options market could prove to be a hurdle in the short term, Banerjee said. To trade such instruments, a bank must recreate the credit VIX by buying and selling options in very specific sizes across the full spectrum, where there may not always be the liquidity to hedge exposure perfectly.
“We think more work needs to go into the effective pricing and hedging of such products, as well as for more standardisation of market-wide conventions,” said Banerjee.
Those developments would include central clearing of credit options and standardisation of option expiry fixings.
TRADABLE BENCHMARK
Citi is not alone in its endeavours. JP Morgan has already traded swaps linked to its own credit version of the VIX that launched in late 2015. The VTRAC-X family of CDS volatility trackers is similar to Citi’s latest iteration and priced off a basket of weighted option prices across all traded strikes for any given expiry.
Although volume has been low to-date, a JPM spokesperson confirmed rising interest across products that give investors access to credit volatility.
The VTRAC-X benchmarks are quoted in price rather than spread, similar to the VIX and reflecting the quoting convention of Markit’s CDX HY. According to JPM analysts, the focus on price addresses concerns that a simple application of VIX methodology to credit options quoted on a spread basis would not accurately reflect the actual level of market implied volatility.
Honestly, we could let the article go on, if you’re keen then http://www.reuters.com/article/derivatives-citigroup-launches-credit-vi-idUSL8N1II2WW
And they say the reason you might not “get” all this is just for the simple lack of education…
So, here’s some education for you from the desks of those that really did bring you the 2007/2008/2009 financial crisis. Unlike the educators of the author of the above piece, we’re here to remind of what happens when this doesn’t net out.
The soul basis for believing the numbers below do not present a massive problem for our financial system is the one simple belief, at the highest level, that this all nets out to a VaR of $219million and everyone will meet their obligations when they must.
Citigroup
Total Assets: $1,792,077,000,000 (slightly less than 1.8 trillion dollars)
Total Exposure To Derivatives: $47,092,584,000,000 (more than 47 trillion dollars)
JPMorgan Chase
Total Assets: $2,490,972,000,000 (just under 2.5 trillion dollars)
Total Exposure To Derivatives: $46,992,293,000,000 (nearly 47 trillion dollars)
Goldman Sachs
Total Assets: $860,185,000,000 (less than a trillion dollars)
Total Exposure To Derivatives: $41,227,878,000,000 (more than 41 trillion dollars)
Bank Of America
Total Assets: $2,189,266,000,000 (a little bit more than 2.1 trillion dollars)
Total Exposure To Derivatives: $33,132,582,000,000 (more than 33 trillion dollars)
Morgan Stanley
Total Assets: $814,949,000,000 (less than a trillion dollars)
Total Exposure To Derivatives: $28,569,553,000,000 (more than 28 trillion dollars)
Wells Fargo
Total Assets: $1,930,115,000,000 (more than 1.9 trillion dollars)
Total Exposure To Derivatives: $7,098,952,000,000 (more than 7 trillion dollars)
Collectively, the top 5 banks have a total of 222 trillion dollars of exposure to derivatives.
Courtesy: The US Office of the Comptroller of the Currency’s (OCC) quarterly report on bank trading and derivative activities, Zerohedge
A little more education and “poof”, you could end up like this:
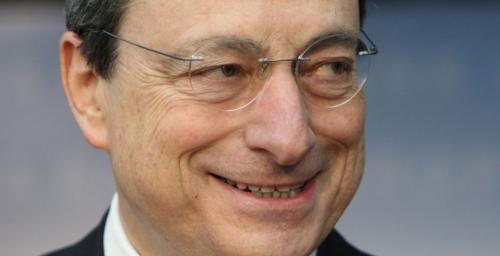
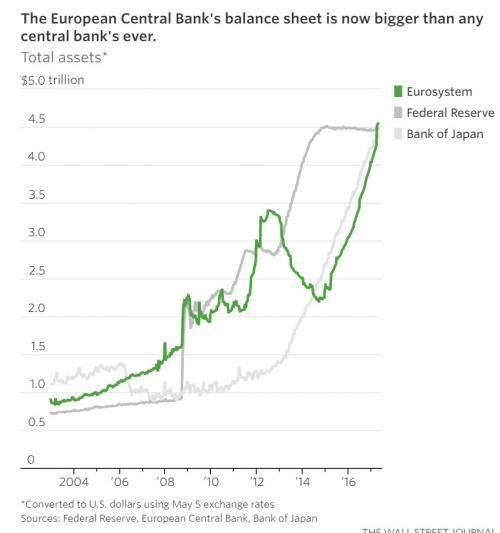
“You look remarkably calm for someone who issues €2.5 trillion out of thin air in the last 2 years, especially when your chief economist says there is no Plan B.”
“It is too early to declare success,” Mr. Draghi said quoted by the WSJ. “Maintaining the current very substantial degree of monetary [stimulus] is still needed for underlying inflation pressures to build up.”
Further to this, the world has gone US$60 trillion deeper into debt since 2008. So you might think… ‘Wasn’t 2008 a debt crisis?
But it’s okay! Backing it all up is this:
The result has really been amazing, nothing else really matters.
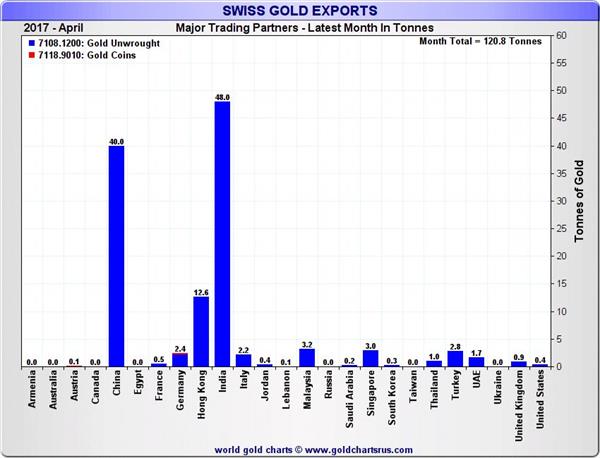
Oh, and we thought we might throw this in below for good measure. This is just one month. One rarely sees large global miners and refiners “advertising” their wares. The reason is that the (roughly, and falling) 3000 tons a year of global gold production is sold as soon as it comes out of the ground.

Recent Comments