
Over the last year or so we’ve sent out many a chart comparing current share price valuations of varying metrics against times gone by. Particularly 1987, 2000 and 2007.
As it turns out it seems this was totally unnecessary because the only chart that really matters is the one below. The one that shows that despite the threat of further monetary tightening, the US, central banks of Europe and Asia have the ALT-P (P for print) button rapid firing.
That’s ALT-P one trillion dollar folks, this year SO FAR (and that was from two weeks ago). “What did they buy” is the question most commonly asked first. The answer? Simple. Everything important to debt, collapse prevention and rates.
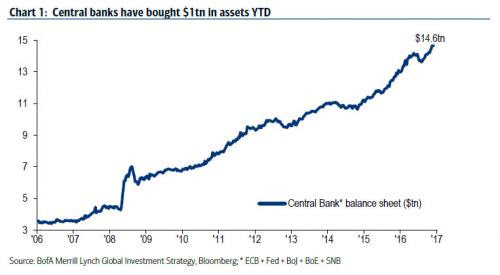
That’s right, 200 BILLION PER MONTH, EVERY MONTH.
So while some investors are busy listening to The US Fed talk about tightening, they’re actually missing the big picture of other major Central Banks printing like it’s 2009. Nicely coordinated.
And none busier than Japan and Europe. The German 2-year bond currently sits at minus .70%. Almost guaranteed to lose money.
The interest rate curve over time looks not much different across the yield curves of other main Euro players and Japan.
Rates are being suppressed because they must be. Too much debt and “associated paper”.
The result of low rates of investment income wherever you look is not much help to “miserable” savers, watching their cash get “punished” in a bank account. Better move some into high yielding ETF, Hybrid or Share, right? Feel the need for income, anyone?
Since central banks have been buying everything, including stocks, to prevent markets from going down, it appears obvious that especially share markets are not even allowed a garden variety correction anymore and god certainly forbids a bear market, ever, again.
Nope, there appears to be a universal understanding of the potential devastation a slight “error” or dislocation in derivative credit markets may cause, and as such, we are in a state of permanent emergency central bank support. May as well make the most of it! (humour).
Whilst on matters of “trillions”, here’s a trick question for you. If the US budget deficit is currently circa $1TRILLION and a tax cut will cut another $2TRILLION from the TAKE and the miracle 2% growth doesn’t materialise to make it up, where will the money come from to fund a $3TRILLION deficit?
It’s easy isn’t it, it’s only a number with a few zeros after it. If its debt is $20TRILLION now and $30TRILLION in a few years’ time, you won’t worry about it too much when it gets to $50TRILLION, right?
This is great news, after 10 years of “mission accomplished”, it’s clear central banks will continue to double down on this policy for “as long as it takes” to achieve growth and inflation targets.
So far, the first target (growth) is getting further away and rather more elusive but the second, despite the best efforts of bureaucratic stat wonks everywhere, seems to be getting closer.
If we call the first stage of monetary (printing?) support, “systemic support”, giving encouragement (low rates) to investors to take more risk, the second is certainly inflation creation, for both assets and cost of living.
Over the next few years, investors will have to be more vigilant than ever before as regards diversification, for the oncoming effect of part two looms ominously like a giant economic meteor (maybe no “Hollywood” fix on this one)!
One such diversification strategy that has been quite effective since, 2007… and way before that, has been gold. News, it does go up and down.
While sentiment towards gold in the West is abysmal – even as gold languishes at record lows when adjusted for inflation – Asian demand remains insatiable.
It’s interesting listening to talking financial heads this morning on CNBC/Bloomberg/Sky, about how investors might be repositioning themselves into more “defensive” assets, such as gold, before more French elections and war drums begin beating in Asia and Europe (again).
Talk about a cracked record, let’s fast forward, current geopolitical events will pass, (again) on the weekend, and by next Monday they’ll be commenting on the fall of gold due to a “softening” of geopolitical events.
This type of investor behaviour, “positioning” in Gold using mostly easily tradable, “liquid”, Over the Counter (OTC) derivative products and has very little to do with owning gold. In fairness, derivative products do track the price.
And like many corners (or rather, main parts) of the financial system, the claim on the “bets products” that are made are as good as the “counterparty” financial institution on the other side of the betting product.
Believe it or not, like a bank lending to housing investor, there are investors out there that like to know what they end up with if things go bad (unthinkable as it is in this day and age!!). What’s my claim on collateral, they ask?
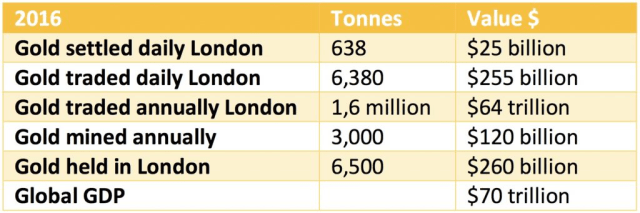
Well, the numbers below, courtesy of Matterhorn Asset Management, provide some food for thought in relation to collateral in the gold market. It’s pretty self-explanatory. The value of gold “traded” annually totals 64trillion and the amount produced annually is 120billion (billion seems so boring now).
We have to be careful here, the “smartest guys in the room” will tell you this all “nets out”. We agree… that is until, like it was in 2008/09, it doesn’t!
Our point with sharing the figures below is really about the scale of the numbers. This is London only!!
More from Matterhorn:
“With just the London Gold OTC market trading 500x annual gold production, total global paper trading including all futures and derivatives will be several times that amount. Since no paper gold market can ever deliver a fraction of physical gold against its commitments, it is totally wrong that the paper market determines the price of physical gold. Without this artificial paper gold market, the price of physical gold would be many times higher. Within the next few years, as gold demand increases, we are likely to see the holders of paper gold run for cover. This will lead to defaults in many paper gold markets including Comex and the London market. Eventually, the physical gold market will settle at prices that will surprise all.
In 2016, 638 tonnes of gold were cleared or settled daily. That means a total volume of 160,000 tonnes is settled annually in London. This is equivalent to all the gold ever produced in history. But the 638 tonnes per day is just the net volume, and one can safely assume that the gross daily volume traded is 10x that amount, which equals 6,380 tonnes daily. Remember that annual mine production is 3,000 tonnes, so more than 2x that amount is traded in London every day. That makes the annual traded gold volume in London a staggering 1.6 million tonnes or $64 trillion.
Just to put this amount in perspective, global GDP is $70 trillion. So the gold traded annually in London is over 500x greater than the annual mine production. Only 5% of the gold settled in London is physical. In addition to the London OTC gold market and Comex, there are other cash and futures markets and the derivative market in gold, which increases total global trading volumes significantly.”
Whilst the above may seem fanciful in the extreme, the most thought provoking element is as follows: what might happen if investors, other than Asian, suddenly woke up and decided, perhaps 3000 thousand years of economic survival of gold for all its properties may not make it quite so useless after all?! And, as such, perhaps one should have more than .03% (global investable average) of one’s portfolio exposed to precious metals, miners and physical!
Maybe even up to just 1% of portfolio weighting to physical is unthinkable whilst the paper form is so easily tradable! If the demand was for physical, which is Matterhorn’s point above, the price action will be very interesting. Maybe there is no natural price discovery at the moment, in many asset classes. One can be sure, however, that nature can be brutal in equilibrium establishment.
It certainly wouldn’t take much, and with Asia consuming well over the current global annual production, one could think the reckoning may not be far away!
And for those who might like to continue on the potential bullish nature of the demonised, non-income producing, pet rock, useless but rare on the periodic tables “precious” metal, ponder this.
Gold (physical) is a mostly uncovered asset in institutional asset allocation models. Most institutional investors have not been interested in Gold because they believe the economy is strong and the Fed is raising rates.
However, especially after the continuing falling GDP numbers, the entire market is discounting a Fed reversal, as it was last year, completely wrong-footing said institutions. They may take a reversal as “Fed panic”, the last straw of credibility torched.
The current gold (and silver) price may be the last possible last chance to front run reality over paper money printing… to infinity.
In regard to real, non-paper assets, the asset price movement of Australian and Canadian property in recent times is mostly domestic leverage driven. However, if you throw into the mix a large movement of Asian paper looking for a physical home, you can see how meaningful a move in large money can be.
Don’t be fooled though, for an investor- being right at the wrong time is the same as being wrong. Size your position accordingly.
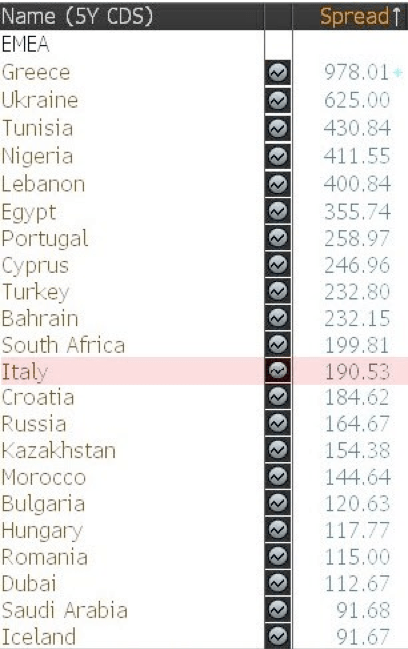
And lastly, we couldn’t let this (below) slip, thanks, Bloomberg. The table relates to Credit Default Swap spreads. The key words being “Credit Default”.
We do not have access to a Bloomberg terminal right now to double check filters but enjoy the wonder of Italy being less creditworthy than Russia.
Just on that, it was confirmed with an esteemed colleague during the week that Russia, population 144m, has almost the same GDP (economic size comparator) as Australia.
Australia is awesome.

Recent Comments