
As opposed to some of the excitement we had in financial markets toward the end of last year and the beginning of January, February has been a yawn. Almost a complete month of record highs for the US Dow industrial average!
A few weeks ago the US Dow index moved through 20 000 as US debt ticked through $20 trillion, without a hiccup! Business as usual!
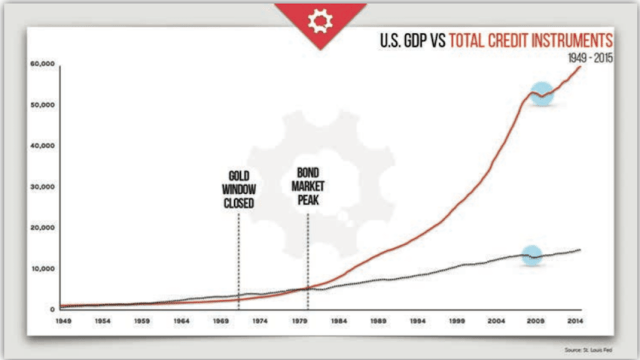
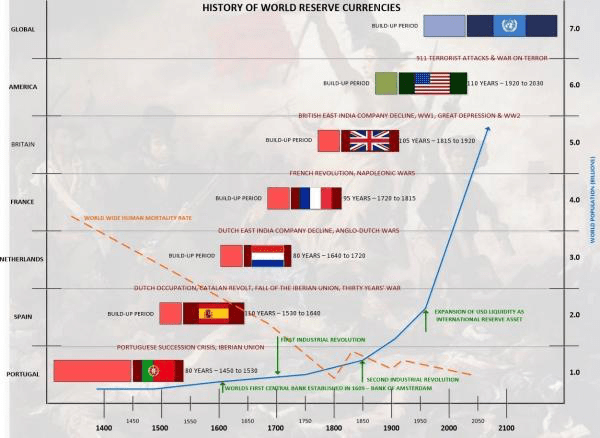
In saying that, the chart below doesn’t refer to the US Debt mentioned above or the “future benefit commitment” US Debt, it’s a total credit instrustment illustration to show the upward trajectory required for “more of the same”.
Before we continue, the next 4 charts are courtesy of our indomitable favourite Global Macro economic analyst, Grant Williams (part Aussie legend too). www.ttmygh.com This guy’s financial analysis is well worth the price of admission!
So quiet have the markets been since the start of 2017, that an eerie calm now presents, to the point where one has to wonder at the wisdom of no volatility with this systemic background.
Over the past seven years, the various financial markets around the globe have melded into a single world market dominated by trading algorithms and the central banks. This new system only knows how to operate effectively in one direction, UP, albeit very slowly in some asset classes.
After 2008/08 and the failure to reform any part of the system that led to that financial seizure, we’ve written extensively about the lengths taken to ensure that even a 10% move on the downside in Global Equity markets is met with furious central bank response in a most co-ordinated manner.
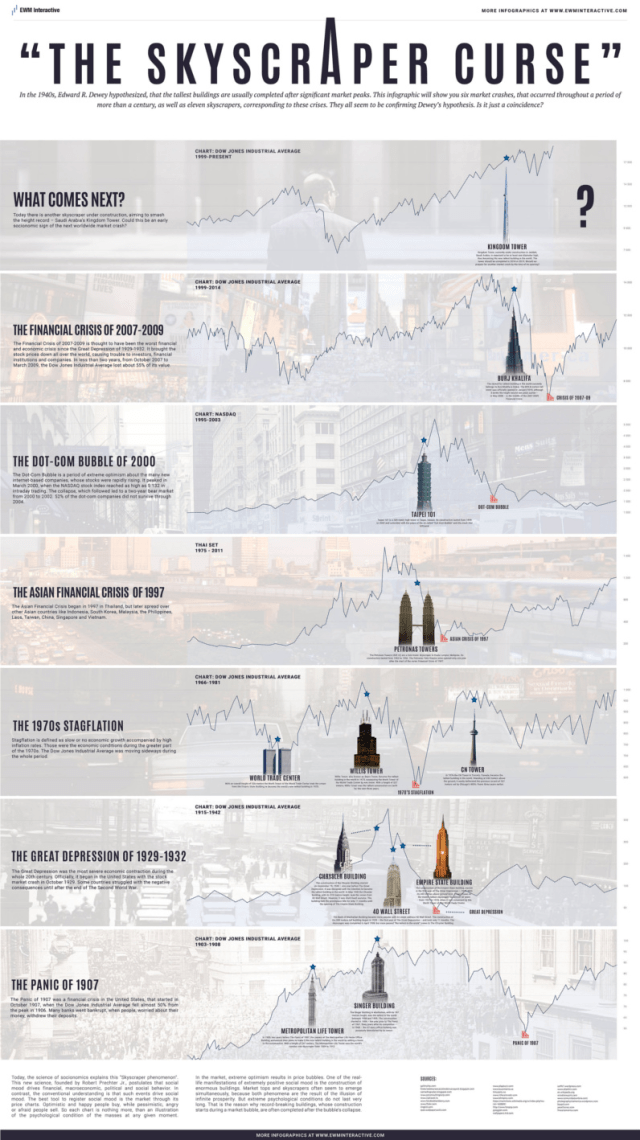
Nowhere have we found it better documented than the illustration below. Every time we look at this chart below we see something new!!
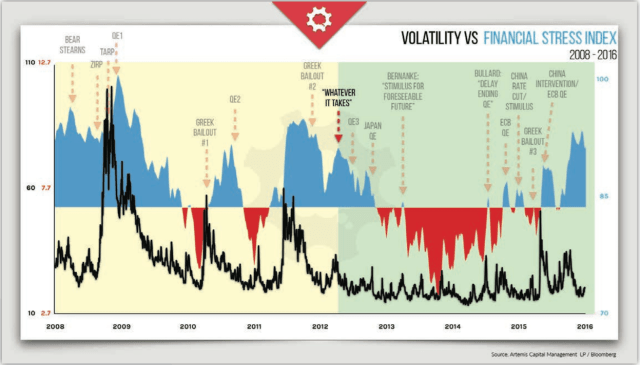
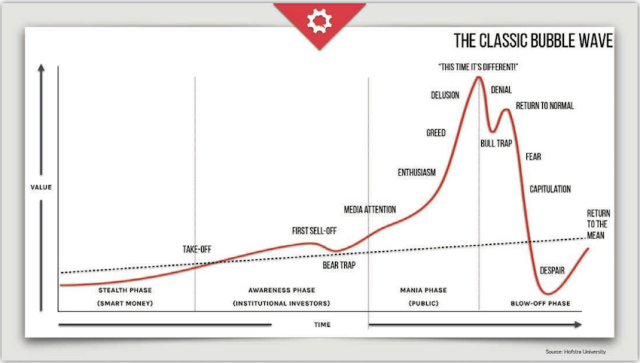
Does this mean that taking the lows out, only to maintain an unnatural “high” is ok these days? Can this charade of debt and derivative leverage continue on in perpetuity? Is “soma” just around the corner? Is the strategy of not allowing market forces to take care of the excesses of previous failed policy, like massive build up in debt and derivatives, a “winning” long term formula? And, does this type of “management” lead to “bubbles”?
Waking up and reading about another new record high in US stock markets certainly suggests life’s good, right?
It really does seem surreal. The worse economic fundamentals and systemic risk gets the more central banks want to “manage” the risks for you.
Honestly, we’re just about ready to throw in the towel, raise the white flag and run down to the bank and see if they’ll let us lever up as much into US stawks as they would into Aussie property, on the same basis, you can’t lose.
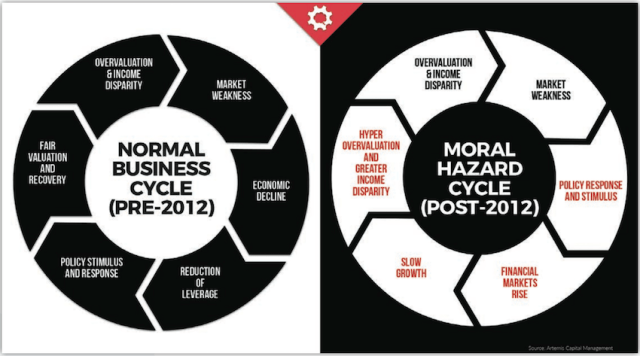
Back to Grant’s analysis, he points out the following as it relates to potential “moral hazard” in the lack of ups-n-downs.
Then, on February 4th, The Fed Warns: “Asset Valuation Pressures Have Increased”, “Leverage Remains Elevated!!!” Thanks for that. We’re sure it took 10 Ivy League future Goldman types at the Fed, all earning 150k in their first job a full month to come up with that gem.
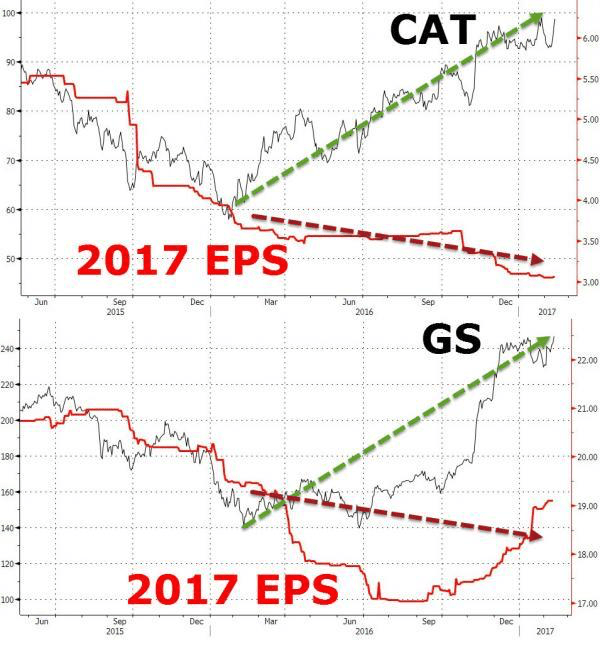
Anyway, from a pure earnings perspective this is how two of the Dow’s biggest components have fared. Caterpillar and Goldman.
You have to take your hat off to Goldman, were they the first to get an earnings Trump bump?
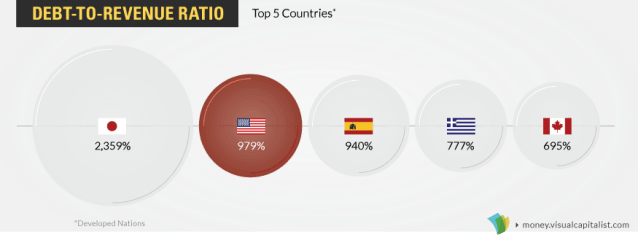
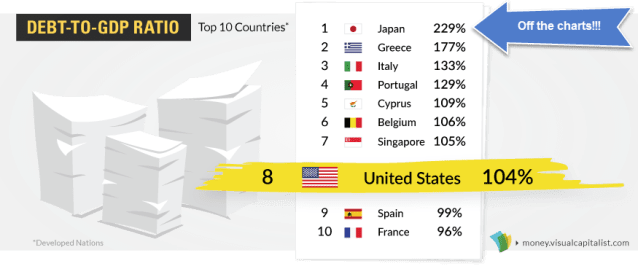
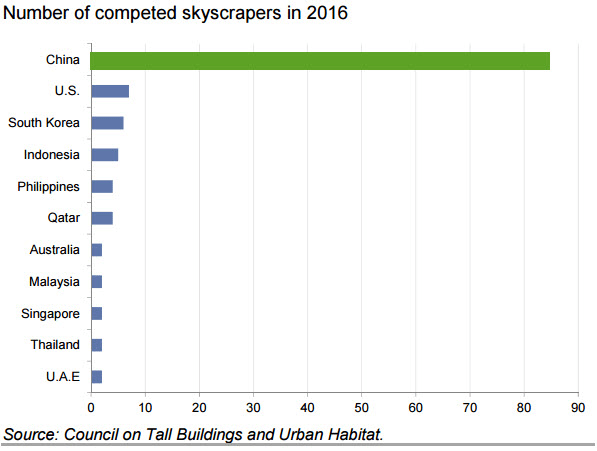
There’s actually not much we have to comment on the next set of charts so we present them with none. Happiness for you.
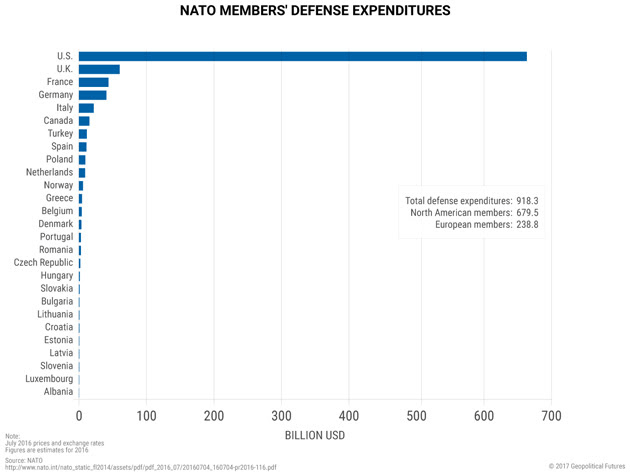
We actually have to comment on the wobbly old NATO defence spend and its encroachment on “no none to fight”.
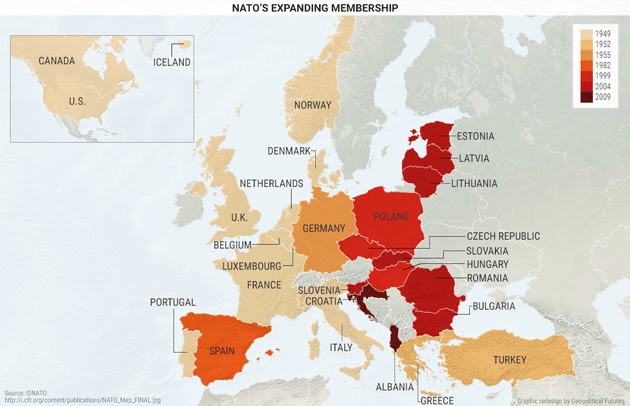
Yeh, nothing to see here either.
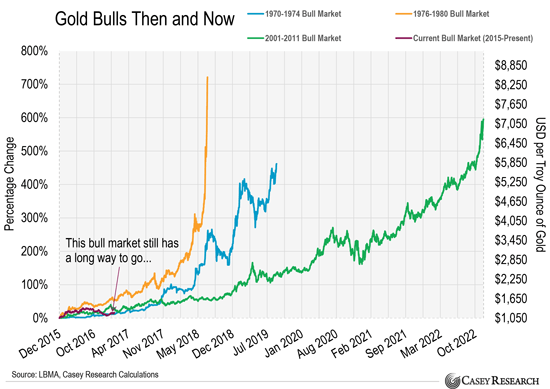
Got some of that useless yellow stuff in your investment portfolio?
Now before we leave you in peace……..

Recent Comments