
Where can we mark the inflection point at which the worst start to the year (EVER) turned into the best recovery a quarter has seen in 6 years?
Was it:
a.) the mysterious calls made to Bank of Englands Mark Carney and the ECB’s Mario (super) Draghi by The US Fed’s Janet Yellen on Feb 11 and 12? By timing, it looks that way, what did they say?
b.) Bank of Japan’s launch into its first round of NIRP (negative interest rate policy)?
c.) The ECB cutting rates further into NIRP whilst ALSO expanding its QE program from €60billion to €80billion per month.
Maybe it was..
d.) The US Fed, missing several opportunities to raise rates on the back of a 2 year, “data based” promise to do so AND lowering its expected 2016 rate hikes from 4 to 2!
Or finally…
e.) Could it have been China pumping $1trillion new credit into its economy.
It’s a tricky question, we know, but if your answer to what actions contributed to one of the most ridiculous stock market rallies in history was ALL OF THE ABOVE, then you’re a winner!!
Over the same period, global economic growth has continued to slow significantly, after peaking in late 2013. We do not feel the need to insert global import/export/trade date to prove this trend as it sends some to sleep whilst missing more interesting stuff, look it up yourself.
And, rather than harp on about the reality you’re about to discover over the next few months, we’ve collected some charts from the last few weeks that better demonstrates a number of stories.
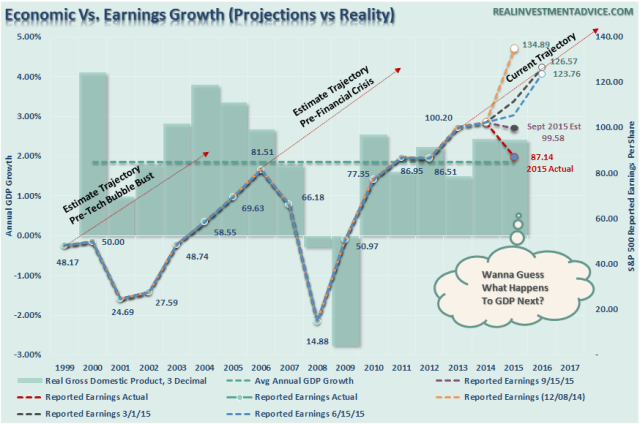
Firstly, a gentle reminder of growth prospects!
 But never fear, more money printing is near.
Ah yes, back to the money printing/QE story!
Below, just to remind you, this was ONE MONTH!!! 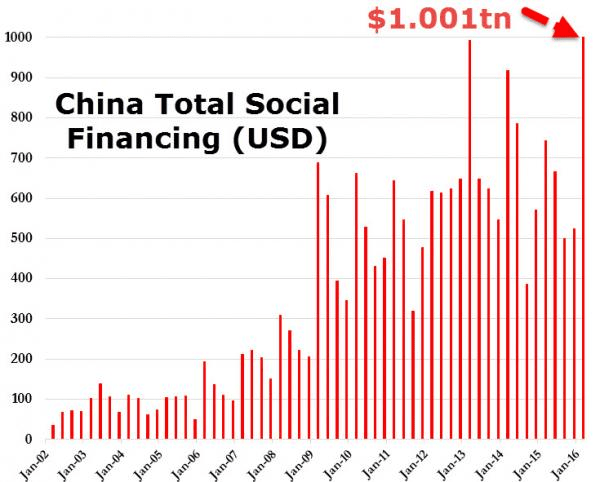
And then, was it any surprise this happened? As result, we’ve seen an incredible surge in commodity prices. To go with this yesterday Australia inflation data looked nothing like this.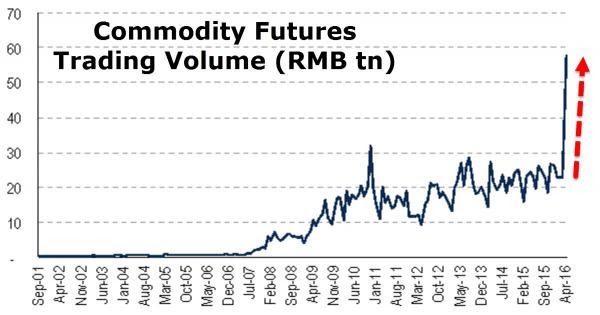
This caused alarm among Chinese commodity exchange authority types to the point where they increased margins and settlement requirements in the respective exchanges, resulting in this below, from a week ago!!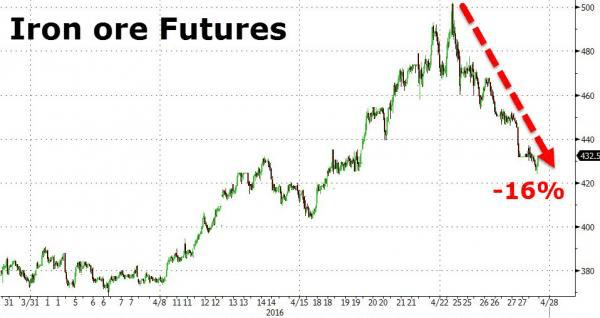
Whatever with this one, probably irrelevant, we just liked it.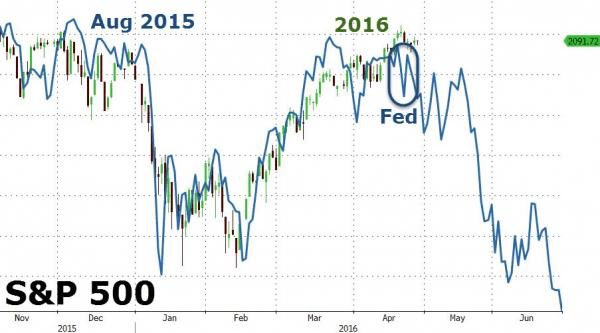
On the other hand, there is nothing to like about the central bank intervention trend, the apex which is demonstrated below!!
Analysts concern themselves with one-third of the entire global bond market in negative interest rate territory but if you’d like a view of the future then Japan is it. They’ve been doing the QE shuffle for more than 20 years.
Japan is so far down the QE rabbit hole that the Bank of Japan, through ETF’s have provided major “liquidity” support to the point where the BOJ is a top 10 shareholder in 90% of the Nikkei 225 constituency!!!! 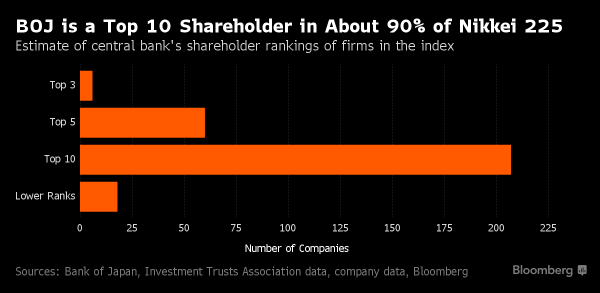
And finally, in probably the biggest, most understated mainstream media let downs in recent times, Deutsche Bank admits precious metals manipulation, several class actions emerge with it, and Deutsche threatens to whistle blow the whole show.
Really there is nothing more to say about this than watch this space. Just because it’s not written in what you regularly read doesn’t make it not happen!!
Given Deutsche’s own well documented systemic stress issues, this is a very, very interesting story. Nothing some freshly printed can’t fix? Maybe?
A small reminder of physical demand in one country. 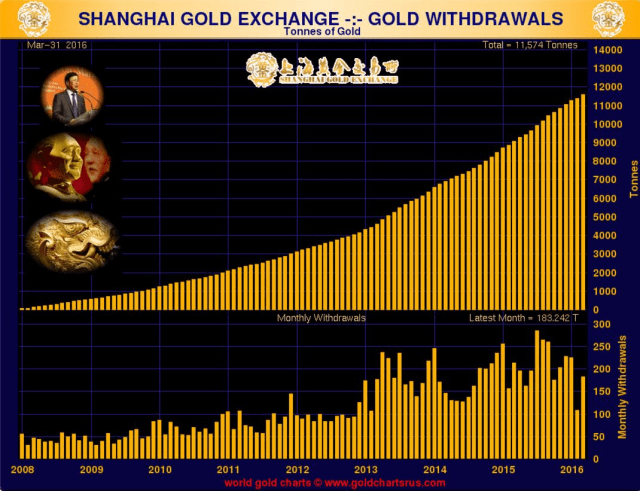
And finally, what precious metals may be capable of once the party cranks up in that useless yellow crap that nobody wants but has been around for a few thousand years.
The longest any paper currency we know of has been around, 200 years? Again, why would anyone want to suppress the price?…….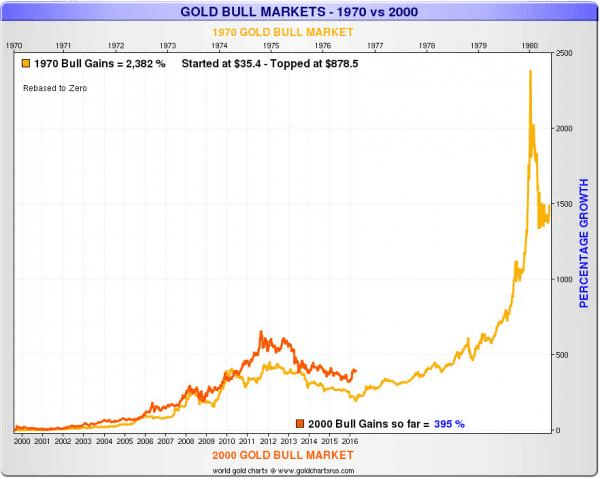

Recent Comments