
With the recent rise in the “not so precious anymore” metal, gold, we thought it time to put the spotlight back on some key goings on in this market.
It’s interesting that Global Gold production has remained stagnant over the last 3 year bear market in the yellow metal. We’ve also found it most interesting that the Chinese Govt. has been actively encouraging their citizens to buy over the corresponding period.
In fact, if one adds the Chinese current yearly 2000+ ton demand to a continued 1000+ ton a year demand from India (even with import restrictions soon to be removed) to the ever increasing demand from other parts of Asia (demand in Japan doubled over the last year, wonder why), Russia, The Arab region and Wealthy Family offices around the world, one really has to be amazed at the behaviour of the price. Particularly in the face of massive paper money creation from Western Central Banks.
Whatever your views on the larger issues at play, reports on voracious demand out of China have been regular. Swiss refiners, running 24/7, certainly agree. But as with most Chinese data, its hard to find a reliable source. Below, is part of regular analysis from Koos Jansen of “In Gold We Trust” fame. He delivers the most comprehensive coverage on the matter of gold consumption in China that we know of. In the extract below you’ll see confirmation from the SGE (Shanghai Gold Exchange) chairman of demand.
As China itself has not reported on it’s own holdings since 2009 one can only wonder what the accumulation has been in total if we also included increases to the central bank hoard.
In other very interesting gold related news last week, the Germans have decided they no longer want 30% of their gold back from the safe hands of the NY Fed. It did cause outrage throughout parts of Germany but with the World Cup in full flight, it soon petered out.
So, they asked for 300tons, get told they can have it over 7 years, get delivered 5 tons and 18 months later decide that it’s better kept in the US? http://www.bloomberg.com/news/2014-06-23/german-gold-stays-in-new-york-in-rebuff-to-euro-doubters.html What a ridiculous story.

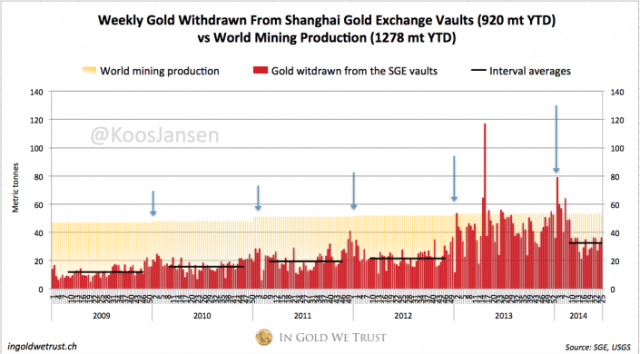
SGE Withdrawals 36 MT in Week 25, YTD 920 MT
Robust demand at the Shanghai Gold Exchange in week 25 (June 16 – 20), physical gold withdrawn from the vaults accounted for 36.3 metric tonnes, according to the Chinese SGE weekly report published last friday.
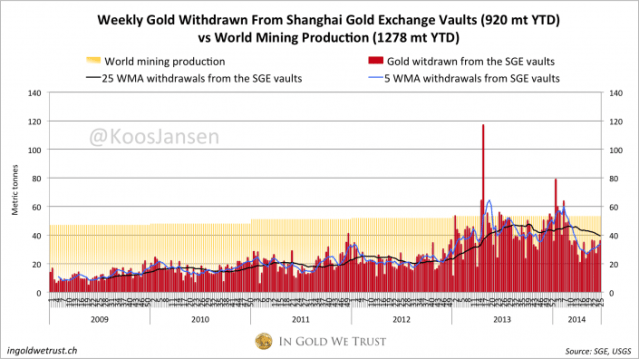
In my opinion Chinese (wholesale) demand, that equals SGE withdrawals, is still trending upward (if we ignore the variant demand from April to November 2013 due to the drop in the price of gold). In the chart below there is a clear pattern in SGE withdrawals; around every new year and the Chinese lunar year there is a spike in withdrawals, this is due to Chinese tradition to buy gold as a gift in this period. In between these spikes withdrawals are relatively steady, with the exception of 2013. The trend to watch is the course of the spikes around new year and the interval periods. So yes, demand came down from extraordinary levels in 2013. Is Chinese demand in a downtrend? I wouldn’t say so.
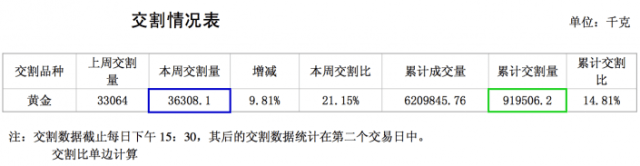
Overview Shanghai Gold Exchange data 2014 week 25
- 36.3 metric tonnes withdrawn in week 25 (16-06-2014/20-6-2014)
– w/w + 9.81 %
– 920 metric tonnes withdrawn year to date.
My research indicates that SGE withdrawals equal Chinese wholesale gold demand. For more information read this. The SGE chairman, Xu Luode, confirmed this correlation last week at the LBMA forum in Singapore. Additionally I called the SGE this morning to have Xu’s statement confirmed. The SGE employee I spoke to said: “Xu noted more than 2000 tonnes was delivered into consumers hands and that could be interpreted as demand.”
This is a screen shot from the weekly Chinese SGE trade report; the second number from the left (blue –本周交割量) is weekly gold withdrawn from the vaults in Kg, the second number from the right (green – 累计交割量) is the total YTD.
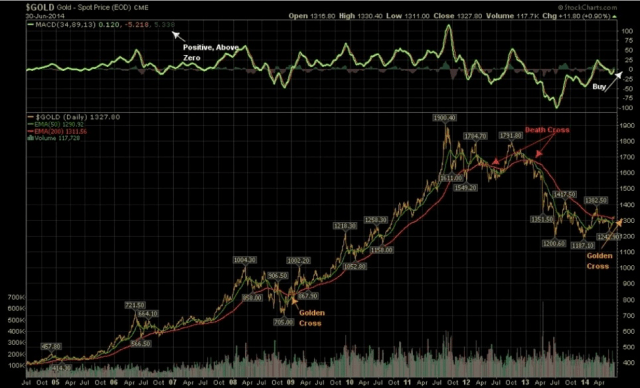
Bonus Chart, Golden Cross Imminent?

Recent Comments