
This is the month where we are normally asked about the “sell in May and go away” theory and what the chances are for a correction this current year. For this topic we’ll focus on the US market as global markets still follow it down, if not up.
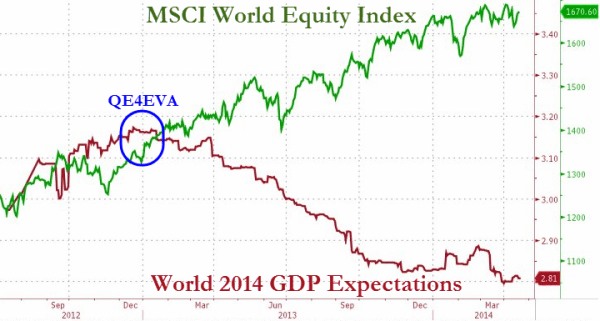
After another (“weather related”??) poor set of GDP numbers out of the US last night, the market over there managed another high. By now you must realise that the only thing pushing the US stock market higher is pure, central bank provided, liquidity. Fundamentals discontinued to matter many moons ago. In fact, from the graph below, we can see it’s been this way for quite some time around the world, not just the US.
The moral hazard of not allowing this market to correct is a story for another day.
So back to May. The following analysis from Marc Faber may be useful. Although he receives some criticism for the occasional bearish calls when the cheerleaders are in full flight, we usually find his analysis well balanced.
Usually (but not always) when market leaders break down, the entire stock market follows. Momentum stocks have lately performed horribly: From the recent highs, 3D Systems is down 49%, Amazon down 25%, Netflix down 29%, Veeva down 59%, LinkedIn down 39%, Twitter down 45% and Facebook is down 21% (just to name a few). There are two more points to consider regarding the outlook for the US stock market. Under the headline “Go Away in May; It’s a Midterm- Election Year” (see Barron’s of April 5, 2014), Jim McTague notes that, “According to 68 years’ worth of data, the market takes a haircut during the second and third quarters, before the midterm, reflecting the economic impact of political turbulence”.

Jim McTague further writes that, “Since 1970, based on total returns, the average second quarter produced a 2.5% decline in the S&P 500,” compared with an average gain of 2.7% during the second quarter for all years. “The safest stock sectors have been consumer staples and health care, with average total returns of 3.1% and 1.5%, respectively. And it’s not only large-caps that get a haircut. Since its inception in 1978, the Russell 2000 also has had its weakest quarters in midterm-election years, with average price declines of 3.5% in the second quarter and 6.6% in the third. Financials and utilities have been the worst- performing, with respective average losses – again, based on total returns since 1970 – of 4.5% and 4.4%” (emphasis added).
Moreover, Wellenreiter-invest.de notes that midterm election years are susceptible to double digit corrections. In 17 of 21 midterm election years since 1930, there were corrections from the market’s high to the low of at least 10%.
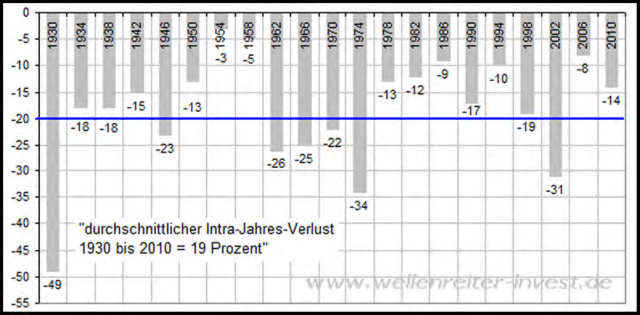
The average intra-year loss was a whopping 19%! The above mentioned,
historically do exceptionally well on the heels of a big up year like 2013, when the S&P 500 went up 29.6%. Since 1954, the 14 times when the S&P rose 20% or more saw an average return of 10.2% the following year.” Ritholtz’s deduction: This year is ‘skewed decidedly positive’ for stocks.” I am less sure about another positive market performance in 2014 because we already had the longest bull market since the 1930s (in the US, investors in other countries haven’t been as well looked after by their central banks).
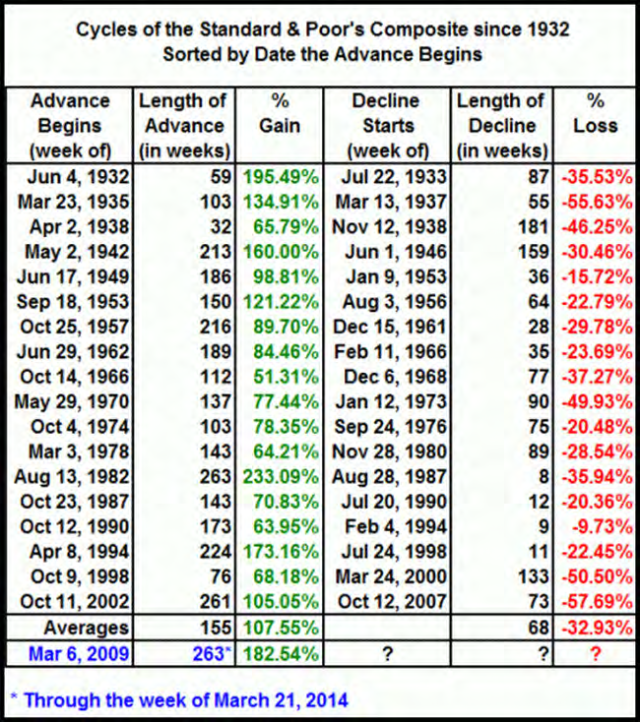
From the figure above we can clearly see and surmise that the bull market, which ended (so far) on April 4, 2014, lasted 265 weeks (as of April 4) and persisted for far longer than the average bull market, which only continued for 155 weeks. The price gain from the March 6, 2009 low was over 182% compared to an average price gain of 107%. So, considering the litany of facts that we are in a midterm election year, that the current bull market carried on for more than 5 years, and that there was widespread speculation in stocks with no earnings and which are selling at extremely high price-to-sales ratios, but which have taken a beating lately (see above), I maintain that the risks of incurring meaningful losses far outweigh the potential further stock market gains. I am, however, not ruling out a final upward push into late July/August, as occurred in 1987. It is unlikely that if such a final rally occurred the momentum stocks would make a new high.
As mentioned repeatedly in earlier reports, we believe that gold shares are building a base from where they are likely to recover further.
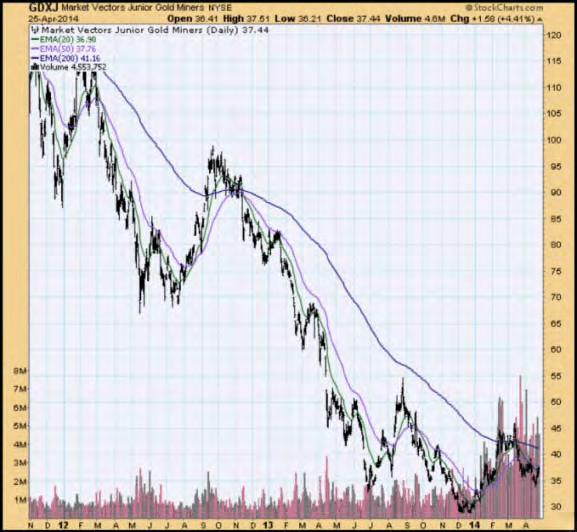
From their recent highs in March 2014, junior gold miners are down 25%. However, they are still up 29% from the December 2013 low. While some further near-term weakness cannot be ruled out, I doubt that the December lows will be revisited. As I have repeatedly stated in the past, I prefer the ownership of physical gold, but I can also see that some miners are now at selling at extremely depressed prices.
The other sectors where investors may find some solace are energy related (oil, drilling engineering) companies and European telecoms and utilities.
Have a great month!

Recent Comments